Difference between revisions of "Simulation Tutorial"
(→Choosing Analysis Length) |
(→Setting Up Manual Stimulus) |
||
| Line 26: | Line 26: | ||
| − | To save in vi, press escape and then type ":wq". | + | To save in vi, press escape and then type ":wq". These options are saved in a file in your simulation directory called spectre.inp |
== Choosing Analysis Type and Length == | == Choosing Analysis Type and Length == | ||
Revision as of 21:41, 13 October 2008
Contents
- 1 Select Analog Environment
- 2 Select Simulator (Spectre)
- 3 Setting Up Manual Stimulus
- 4 Choosing Analysis Type and Length
- 5 Adding Model Library Files
- 6 Selecting Outputs to be Plotted
- 7 Running Simulation and Ouput Window
- 8 Waveform - Zooming and Trace
- 9 Power/Energy Analysis with UltraSim
- 10 Documentation
Select Analog Environment
With the schematic file open, Ultrasim can be invoked from within Virtuoso.
- Select Launch → Simulation → Spectre.
This creates a new menu item called "Spectre" next to "NCSU".
Select Simulator (Spectre)
Virtuoso Analog Design Environment supports various simulators such is hSpice, Spectre, and Ultrasim. Spectre was previously chosen. Now, run
- Select Spectre → Initialize.
A follow up window will pop up giving your simulator options. Press ok.
Simulation Run Directory indicates where your simulation files will be stored.
The generated netlist file will be stored within in a file called "netlist". All of the other options are stored in this directory as well.
Setting Up Manual Stimulus
If you did not add voltage sources to drive the inputs and outputs, you can edit a stimulus file directly by choosing: Ultrasim → Stimulus → Edit Stimulus File This will open a file in vi where you can add something like this:
// Spectre Source Statements
vdd (vdd! 0) vsource dc=1.8
gnd (gnd! 0) vsource dc=0
vin (A 0) vsource type=pulse val0=0 val1=1 period=100n delay=10n rise=0.1n fall=0.1n width=50n
To save in vi, press escape and then type ":wq". These options are saved in a file in your simulation directory called spectre.inp
Choosing Analysis Type and Length
From the Analog Environment window
- Select Spectre → Stimulus → Edit Analysis/Options File
This will bring up a smaller window where you should uncomment the line shown here and change it with an appropriate simulation length:
// Analyses
// dc1 dc oppoint=logfile homotopy=all
tran1 tran stop=300n errpreset=moderate
These options are saved in a file in your simulation directory called spectre.sim.
Be sure to choose a stop time that is greater than the period of the input signal.
Spectre supports the SI prefixes so 500u would be 500 micro seconds.
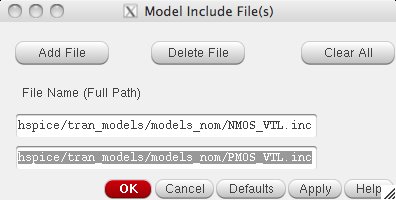
Adding Model Library Files
The next step is to add the spice data for the simulator.
- Select Setup → Model Libraries .
We will be adding the data for the Nmos and Pmos transistor using the TSMC 180nm process.
- Click on browse and go to: /mada/software/techfiles/NCSU_CDK_1.5.1/models/hspice/public
Make sure you click the .. first all the way till you see mada
- Select files
- /mada/software/techfiles/ncsu/models/hspice/public/tsmc18dN.m
- /mada/software/techfiles/ncsu/models/hspice/public/tsmc18dP.m
- /mada/software/techfiles/ncsu/models/ground.sp
Be sure to click on add after selecting each file. Select OK when finished.
Selecting Outputs to be Plotted
From the Ultrasim menu
- Select Outputs To Be Plotted → Select on Schematic
Now refer back to your schematic (or layout) and click on various parts to add it to the output section of the Analog Design Environment Window (for example, the output pin Z) in your schematic that you want to be plotted. Repeat this as necessary for all nets you want to see (for example, the input pin IN).
Running Simulation and Ouput Window
- Select Ultrasim → Netlist/Simulate
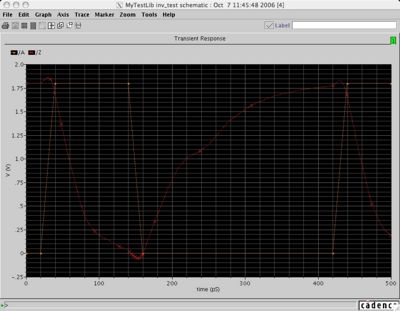
This will generate the netlist file, run the simulation, and feed the results to the waveform viewer.
Waveform - Zooming and Trace
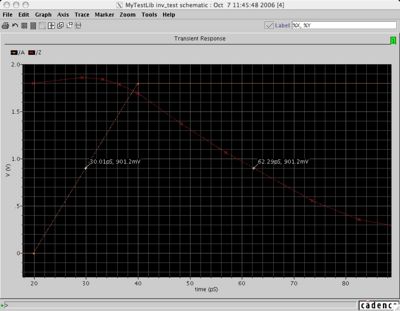
With the waveform window open, you can zoom in and find exact values.
Zoom
- Select Zoom → X Zoom .
- Now click and drag in the waveform window to select the x-range you want to zoom to.
Tracing
- Select Marker → Place → Trace Marker
- Click on one of the waveforms in the window. This places a small label on the waveform. You can drag this marker anywhere on the waveform.
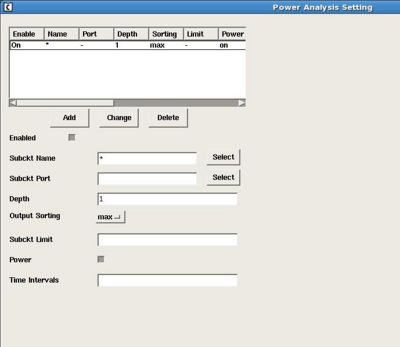
Power/Energy Analysis with UltraSim
To enable power analysis in Ultrasim
- 1) go to Simulation->Options->Analog
- 2) In the "Advanced Checks" section, check the button near "Power analysis" and click on Setting
- 3) In the window that opens up
- 3.1) Enter * for the "subckt name"
- 3.2) Select max in the "Output Sorting" section
- 3.3) Click on the power and enabled button
- 3.4) Click on Add at the top
- 3.4) Click OK to close the window
- 4) Click OK to close the "Simulator Options" window
- 5) Simulate as usual (Simualte->Netlist and Run)
- 6) Look for a file called "input.pa", most likely under /cse/grads/USERNAME/cadence/simulation/comb_adder/UltraSim/schematic/psf/input.pa
- The file will list Max,Avg and RMS power for each pin in your design, and the time in which the maximal power consumption occurred.
Energy is simply the RMS power multiplied by time
Documentation
Finally, for more help...
- Open file:///home/cadence/MMSIM61/doc/UltraSim_User/UltraSim_UserTOC.html in your web browser on firedance.


