Difference between revisions of "Simulation Tutorial"
(→Waveform - Zooming and Trace) |
(→Exporting Tip) |
||
| Line 111: | Line 111: | ||
=== Exporting Tip === | === Exporting Tip === | ||
| − | :If you intend to export the plot | + | :If you intend to export the plot, it would be wise to change the background color to something other than black. In addition you can change the width of the lines by right clicking on the line and selecting properties. |
== Power/Energy Analysis == | == Power/Energy Analysis == | ||
Revision as of 04:06, 6 December 2009
Contents
[hide]Select Analog Environment
With the schematic file open, Spectre can be invoked from within Virtuoso.
- Select Launch → Simulation → Spectre.
This creates a new menu item called "Spectre".
Select Simulator (Spectre)
Virtuoso Analog Design Environment supports various simulators such is hSpice, Spectre, and Ultrasim. Spectre was previously chosen. Now, run
- Select Spectre → Initialize.
A follow up window will pop up giving your simulator options. Press ok.
Simulation Run Directory indicates where your simulation files will be stored.
The generated netlist file will be stored within in a file called "netlist". All of the other options are stored in this directory as well in separate files. When you run the simulation, all the options are put together in a single file called si.inp. This is useful for storing seperate simulation setups for different parts of your design.
Setting Up Manual Stimulus
It is easier to not add voltage sources to the inputs directly and instead make stimulus in a file. You can edit a stimulus file directly by choosing: Spectre → Stimulus → Edit Stimulus File This will open a file in vi where you can add something like this:
// Spectre Source Statements
v0 (VDD VDD!) resistor r=0
v1 (GND GND!) resistor r=0
VDD (VDD! 0) vsource dc=1.2
GND (GND! 0) vsource dc=0
vin (A 0) vsource type=pulse val0=0 val1=1.2 period=100n delay=10n rise=0.1n fall=0.1n width=50n
C1 (Z 0) capacitor c=200ff
To save in vi, press escape and then type ":wq". Note that the first two lines are a hack to get spectre to realize that vdd and vdd! are the same signal (similarly for gnd and gnd!).
These options are saved in a file in your simulation directory called spectre.inp. For more information on Spectre commands you can look at the Spectre manual:
/mada/software/cadence/MMSIM61/doc/spectreuser/spectreuser.pdf
Choosing Analysis Type and Length
From the Analog Environment window
- Select Spectre → Stimulus → Edit Analysis/Options File
This will bring up a smaller window where you should uncomment the line shown here and change it with an appropriate simulation length:
// Analyses
// dc1 dc oppoint=logfile homotopy=all
tran1 tran stop=300n errpreset=moderate
These options are saved in a file in your simulation directory called spectre.sim.
Be sure to choose a stop time that is greater than the period of the input signal.
Spectre supports the SI prefixes so 500u would be 500 micro seconds.
Adding Model Library Files
The next step is to add the spice data for the simulator.
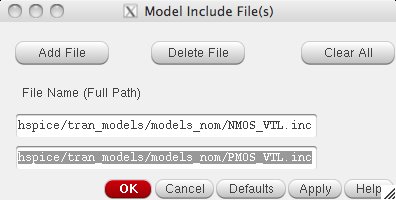
- Select Spectre → Stimulus → Model Include Files .
We will be adding the data for the NMOS and PMOS transistor using the FreePDK45 45nm process.
Click on Add File and add these files:
/mada/software/techfiles/FreePDK45/ncsu_basekit/models/hspice/tran_models/models_nom/NMOS_VTL.inc
/mada/software/techfiles/FreePDK45/ncsu_basekit/models/hspice/tran_models/models_nom/PMOS_VTL.inc
Select OK when finished.
These options will be added to a file called spectre.include.
Running Simulation and Ouput Window
- Select Spectre → Netlist/Simulate
This will generate the netlist file, run the simulation, and save the results for the waveform viewer. You should re-run this every time you change your schematic.
If this pops up a window that says it failed, fix the previous options. You need to debug this by looking at the output of the simulator with Spectre → Show Outputs → Show Run Log → Show Foreground Log and Spectre → Show Outputs → Show Run Log → Show Background Log (or all of it in si.log). This will show you if it even got to the point of running the simulator. The simulator output of the simulator itself can be seen with Spectre → Show Output (or in the file si.out).
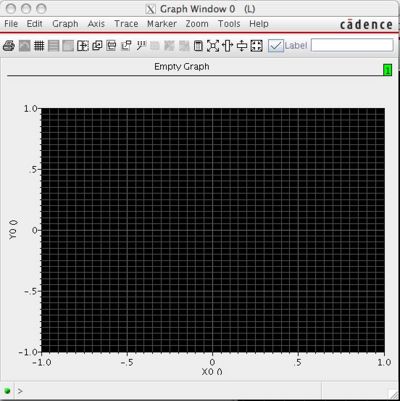
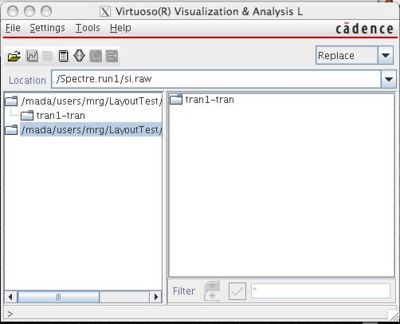
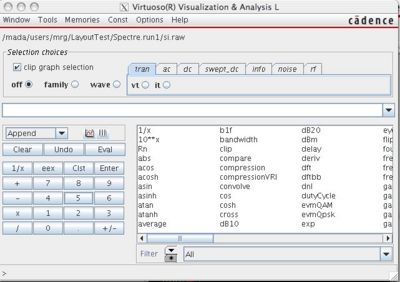
If it succeeded, you can select Spectre → Waveform Tool . When you do this, you get three windows:
Select the "File Open" icon and then find the appropriate "raw" result file in the browser. This should open the data in the browser. Double click on the transient simulation directory and you should see signal names that correspond to your design. Double click on "A" to add it. Change the upper right option to "Append" and double click on "Z" to add it as well. If you don't change the option, it will replace the A waveform with Z. If there are problems with vdd! and gnd! you can debug that here.
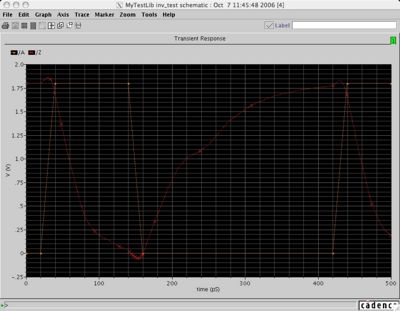
You should get something that looks similar to this in the graph window:
Note that your signals should always rise to full vdd (1.2V) and down to gnd (0V) or else something is wrong with your logic. This is CMOS so everything is "rail to rail". It is likely an unconnected supply voltage or floating body.
Waveform - Zooming and Trace
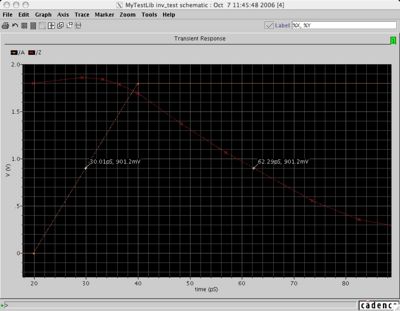
With the waveform window open, you can zoom in and find exact values.
Zoom
- Select Zoom → X Zoom .
- Now click and drag in the waveform window to select the x-range you want to zoom to.
Tracing
- Select Marker → Place → Trace Marker
- Click on one of the waveforms in the window. This places a small label on the waveform. You can drag this marker anywhere on the waveform.
Separate Windows
- Sometimes the window will get too cluttered. You can plot each signal in a separate window by clicking the 4th icon in the toolbar from the left to put it in "Strip Mode".
Reloading
- If you make a change and resimulation, you can simply click File → Reload
Exporting Tip
- If you intend to export the plot, it would be wise to change the background color to something other than black. In addition you can change the width of the lines by right clicking on the line and selecting properties.
Power/Energy Analysis
To enable power analysis in Spectre, add this statement to your input stimulus:
save :pwr
This will save the instantaneous power of your entire circuit. You can specify a specific instance with "x1:pwr" for an instance called x1. Re-run your simulation.
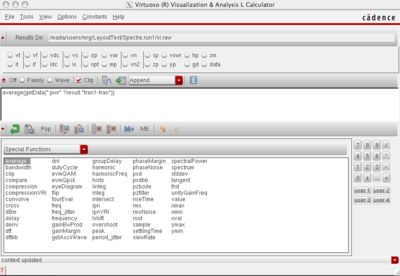
You can then plot the power in the waveform viewer. It will be shown with all the other signals. In order to find the average power, you select :pwr and click on the calculator option instead of the plot option. In the calculator window, select "average" in the special functions. Then select the "Evaluate" button. (It is on the right of the "Clip" option and to the left of the Table and Append options). This will give you the average power in Watts.
To enable power analysis in Ultrasim
- 1) go to Simulation->Options->Analog
- 2) In the "Advanced Checks" section, check the button near "Power analysis" and click on Setting
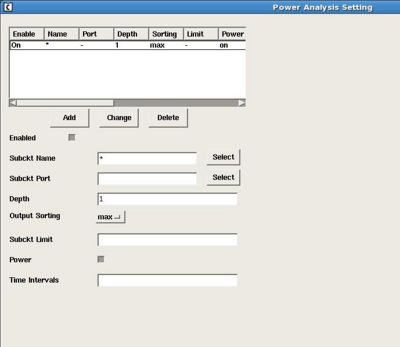
- 3) In the window that opens up
- 3.1) Enter * for the "subckt name"
- 3.2) Select max in the "Output Sorting" section
- 3.3) Click on the power and enabled button
- 3.4) Click on Add at the top
- 3.4) Click OK to close the window
- 4) Click OK to close the "Simulator Options" window
- 5) Simulate as usual (Simualte->Netlist and Run)
- 6) Look for a file called "input.pa", most likely under /cse/grads/USERNAME/cadence/simulation/comb_adder/UltraSim/schematic/psf/input.pa
- The file will list Max,Avg and RMS power for each pin in your design, and the time in which the maximal power consumption occurred.
Energy is simply the RMS power multiplied by time
Documentation
Finally, for more help...
- Open file:///home/cadence/MMSIM61/doc/UltraSim_User/UltraSim_UserTOC.html in your web browser on firedance.

